Split climatology maps into more subtasks #282
Conversation
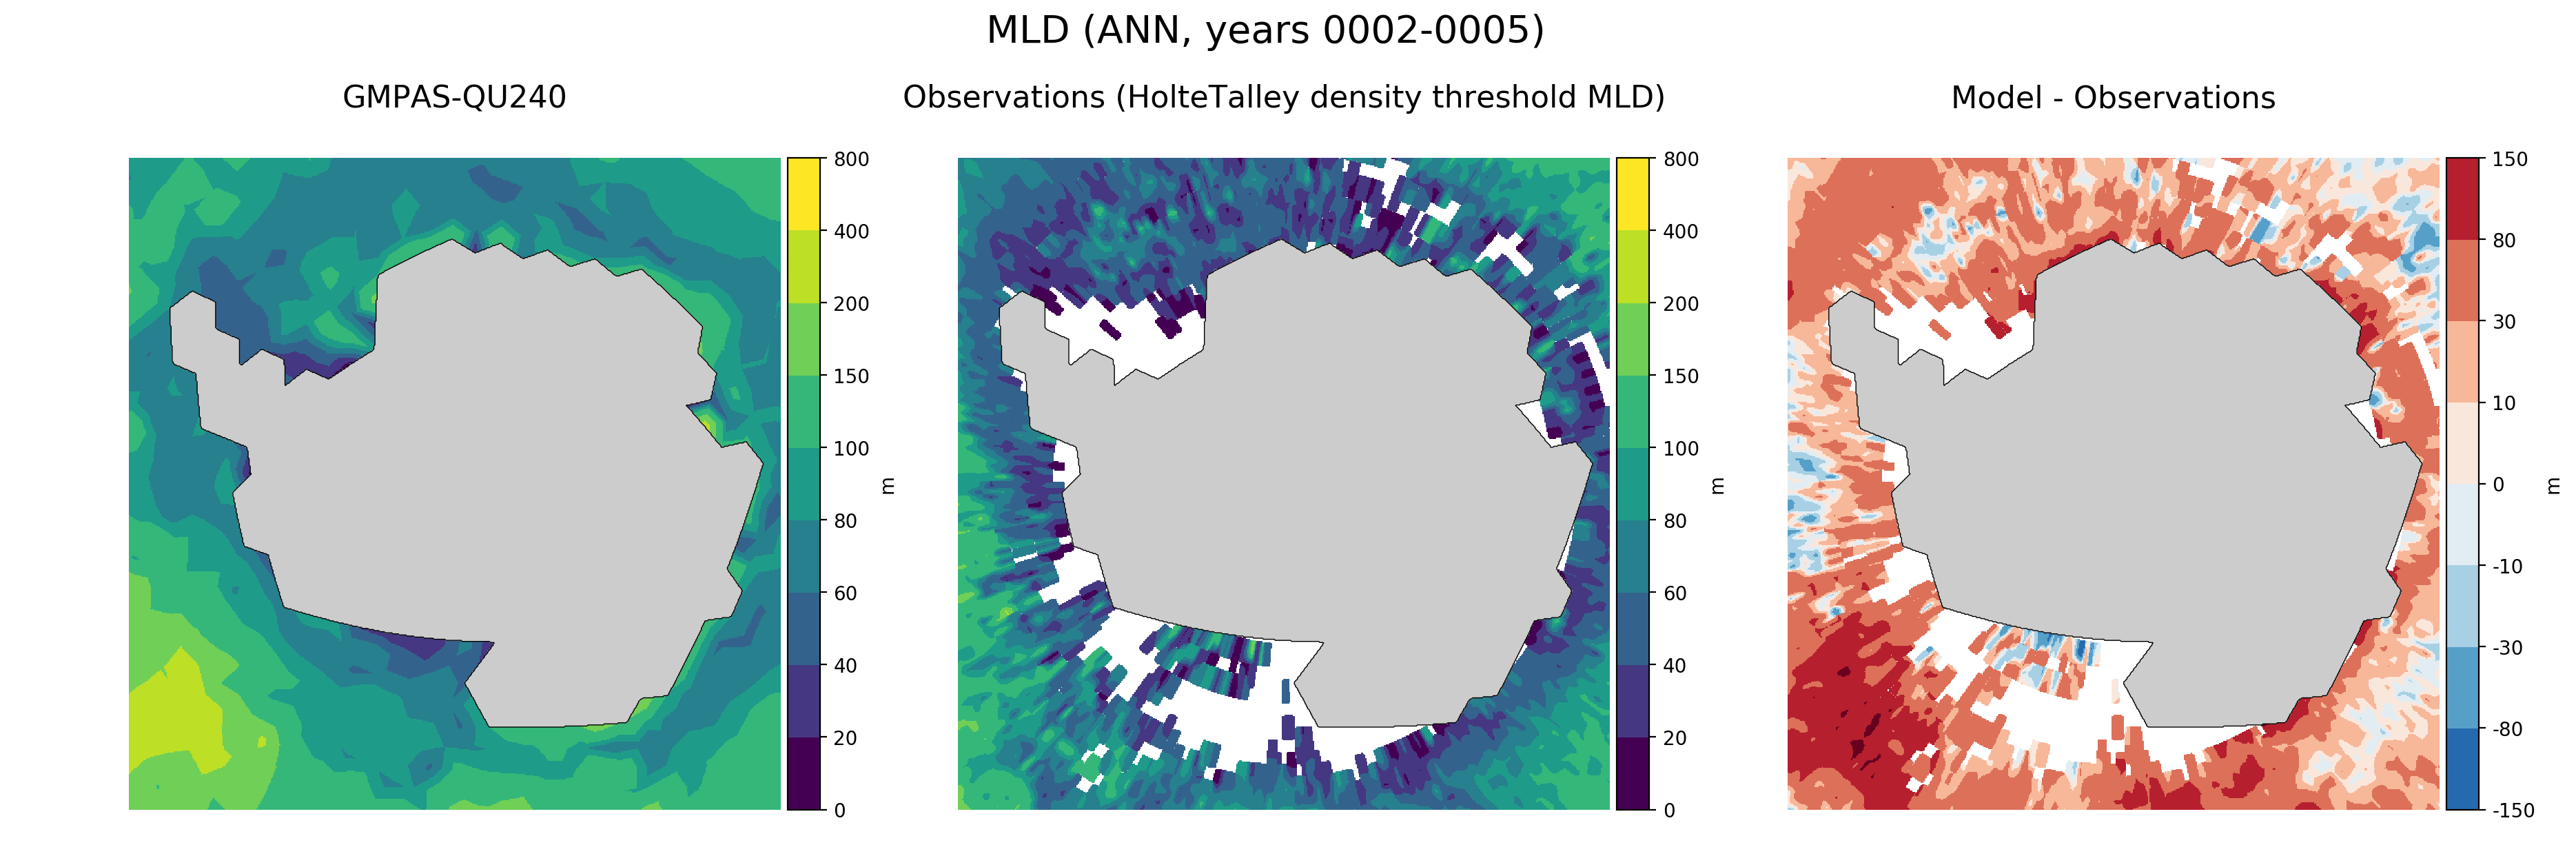
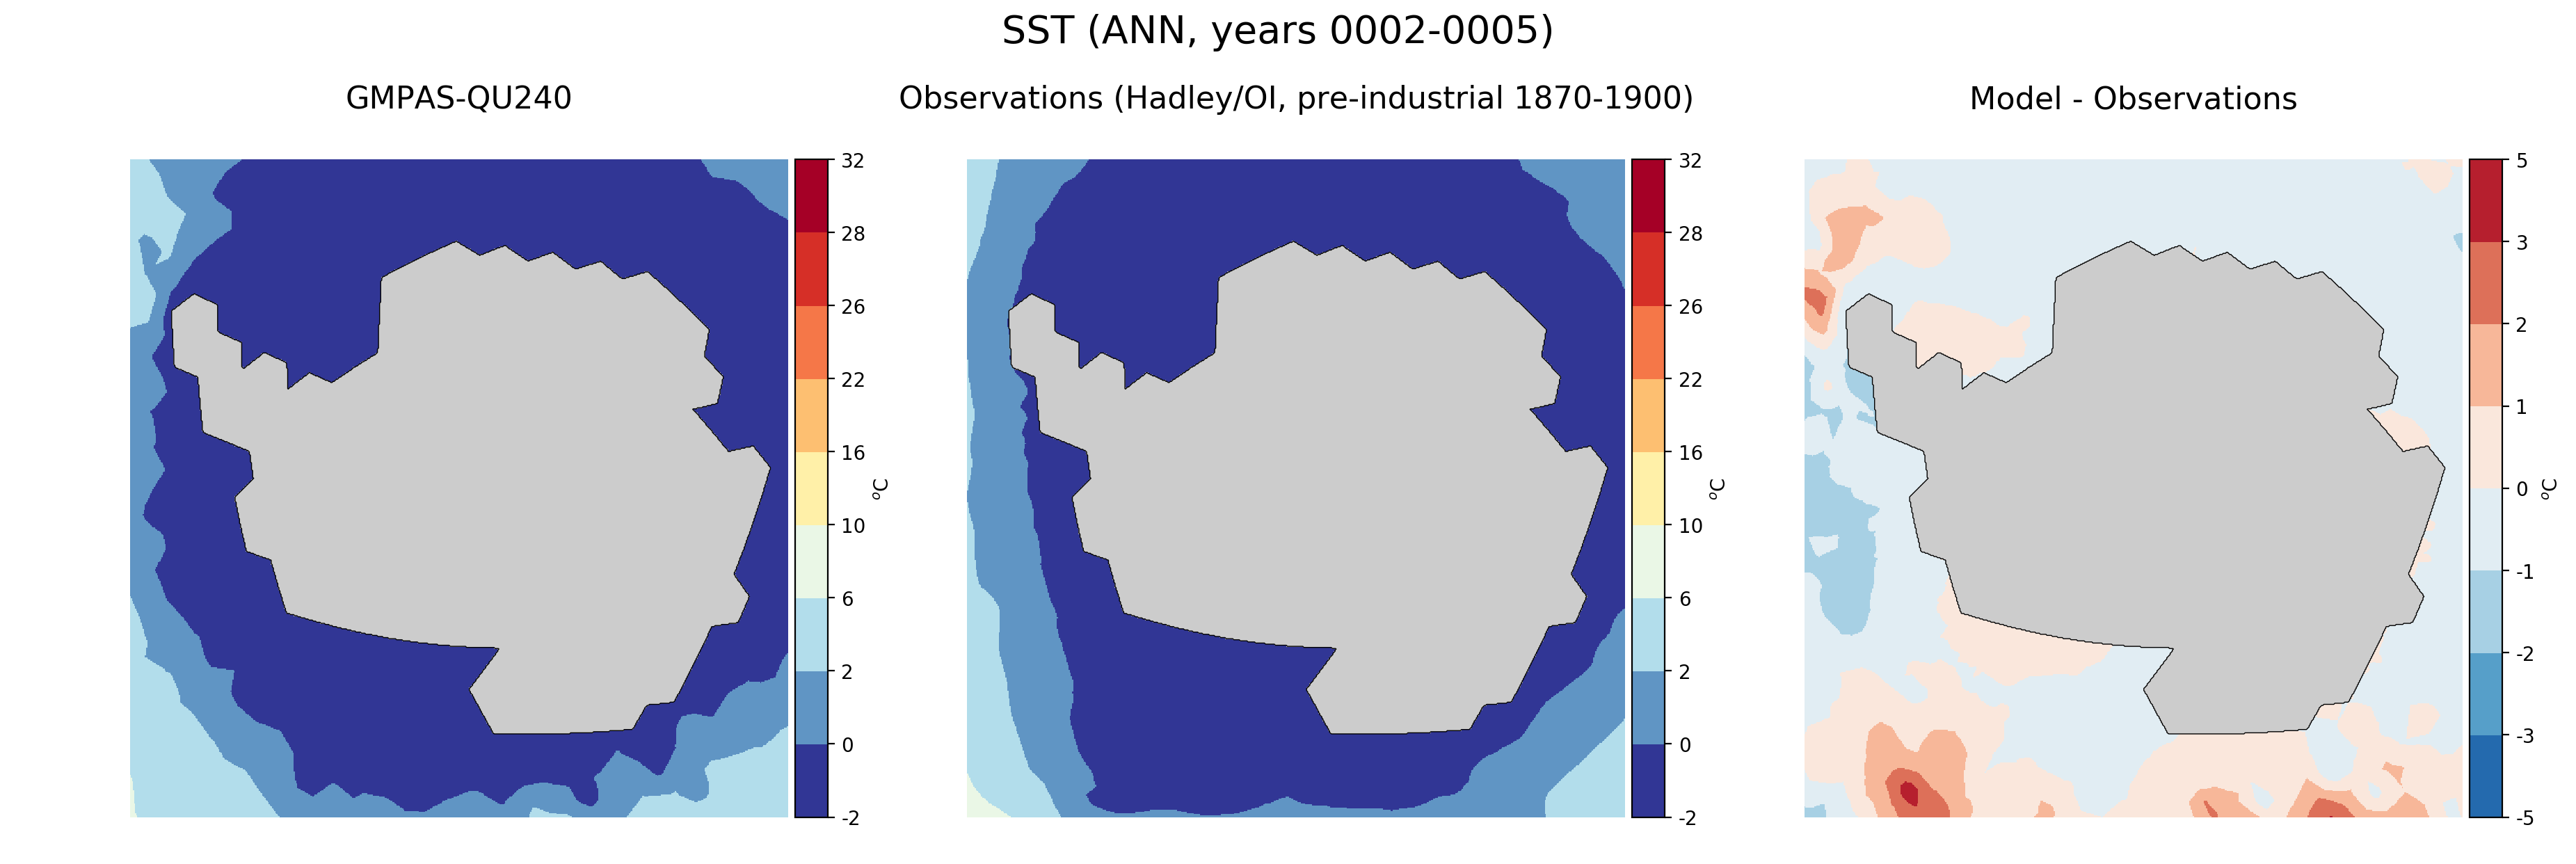
TestingI have tested this on my laptop with the QU240 run (copied from Edison) using both python 2 and 3. The resulting Antarctic plots look as follows (just a few examples): |
|
By default, the Antarctic plots aren't performed but they would be easy to add to any runs where they might be useful (e.g. where we are focused on Antarctic biases). |
|
@milenaveneziani, I know you're working on other things anyway. Maybe hold off on reviewing this PR until I make some further changes. I'm adding a "don't merge" tag. |
|
Okay, so clearly I have some work to do on both documentation and CI... |
There is a subtask for remapping observations and one for making
each plot (that is, one per season and comparison grid).
As with the ocean, there is subtask for remapping observations
(which actually does very little since the observations are already
on the comparison grid) and one subtask for each plot (meaning
each season and, for concentration, for each set of observations).
SST, SSS and MLD can be plotted on this grid by adding 'antarctic'
to the comparisonGrids list.

A plotting routine for data on a ploar grid has also been added,
including support for both index and norm color maps (the latter
will be used for melt rates and Antarctic temperatures at various
depths).
20e8c51 to
cac0d78
Compare
Further TestingI reran the QU240 test case with python 3 (this time with the subtask for remapping observations included). I also made sure pytest passed on my machine with python 3. I made sure the documentation builds correctly and includes the new tasks. |
|
@milenaveneziani, I'm currently running some tests on Edison. If you don't mind running a test or 2, that would be great. Let me know if you have any concerns as well. |
|
@vanroekel, I'd appreciate any feedback you might have on these changes, given that it affects code you wrote. |
|
sure, I'll run some tests later today. |
Still Further TestingI successfully tested with the QU240 run and both python 2 and python 3 on an Edison login node. I tried to test on a batch node but had hdf5 problems. I reverted to hdf5 1.8.18 from hdf5 1.10.x (I think) in my test anaconda environments ( Here is the resulting webpage: |
cac0d78 to
6bb5aa0
Compare
|
I ran a test yesterday on edison, and it seems to have completed fine. But I seem to understand there have been more changes since yesterday night (MST)? |
|
@milenaveneziani, the only important changes since yesterday have been to documentation and unit tests, so your test results should still be valid. |
|
yeah, I thought I had fetched the latest changes, but I guess I was wrong (saw some repeated output statements that I don't seem to see in this version). |
| comparisonGridName = self.comparisonGridName | ||
| self.logger.info("\nPlotting 2-d maps of {} climatologies for {} on " | ||
| "the {} grid...".format(self.fieldNameInTitle, | ||
| season, comparisonGridName)) |
There was a problem hiding this comment.
ah, here is the repeated logging statement (above). It's here and then again below, in _plot_lat_lon (not in _plot_antarctic). So I guess I would remove it from _plot_lat_lon.
|
@xylar: results of my latest test on edison are here: all worked well on the login node. I will now do a test in batch. |
|
Test on edison compute nodes worked great as well. |
|
Thanks very much @milenaveneziani! I'll fix the redundant print (thanks for noticing that!) and merge soon. |
This merge creates a generic subtask for remapping observations to the
comparison grid that can be used by both ocean and sea-ice tasks.

Tasks for ocean and sea-ice climatology maps are broken out into
their own files, each of which defines the task and a subtask for
reading in the observational data set and defining the source
mesh/grid for the observations.

In each case, the main task now simply spawns subtasks for
remapping model results and observations and for plotting the
results and is otherwise empty.
There was a conflict between the name of the module and the name
of the class that was confusing sphinx.
Fix imports of config parser

Remove test for obs. climatology file name, which has moved to
the remap obs. climatology subtask.
6bb5aa0 to
e5f8606
Compare
For both ocean and sea-ice climatology maps, there is a subtask for remapping observations and one for making each plot (that is, one per season, comparison grid and set of observations).
SST, SSS and MLD can be plotted on an Antarctic stereographic grid by adding 'antarctic' to the
comparisonGridslist.A plotting routine for data on a polar grid has also been added, including support for both index and norm color maps (the latter will be used for melt rates and Antarctic temperatures at various depths).
The climatology map plotting subtask under each component has been split out into its own file, the remapping subtasks are under
mpas_analysis.shared.climatologyand each climatology map task has been split into its own file (e.g.climatology_map_mld.py) to make it easier to figure out what is going on.